The data set used in this project consists of 7147 borehole samples of 9 spatial variables collected at a geological domain in the East Texas oil fields. As discussed before, four of these variables are selected for this project: effective porosity (Phie) which is the primary variable, bulk mass fraction of oil (BMFO), saturation of oil (SO), and effective water saturation (SWE). Figure 10 shows the location map of the East Texas oil fields, and figures 11 and 12 illustrate the location map of the samples in the horizontal and vertical orientations.
Figure 10 - Map of the Eastern Texas oil fields (www.aoghs.org).
Figure 11 - Location map of the boreholes in the horizontal orientation. The colors represent values of effective porosity.
Figure 12 - Location map of the samples in the vertical orientation. The colors represent values of effective porosity. Each point represent a sample and each vertical line is a borehole.
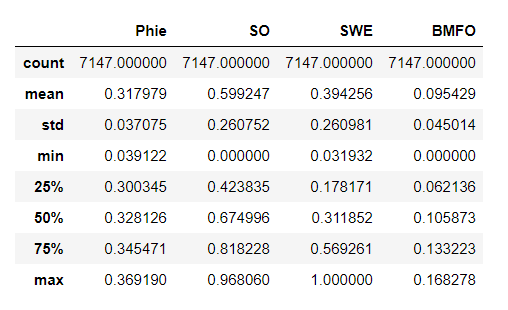
Figure 13 depicts a table of summary statistics of the four variables. All these variables are in a range of 0 to 1, but their value convey different meanings. Effective porosity of 1 means that porosity is infinite at that sample and any fluid would pass that point with no resistance from the material on its way and 0 means there is no flow fluid. Oil saturation in a sample is a measure of how much of that sample's volume consists of oil. Bulk mass fraction of oil is a ratio which describes how much of the mass at that sample location consists of oil. Effective water saturation measures how much of the fluid volume at a location is water.
Figure 13 - Summary statistics of the four spatial variables.
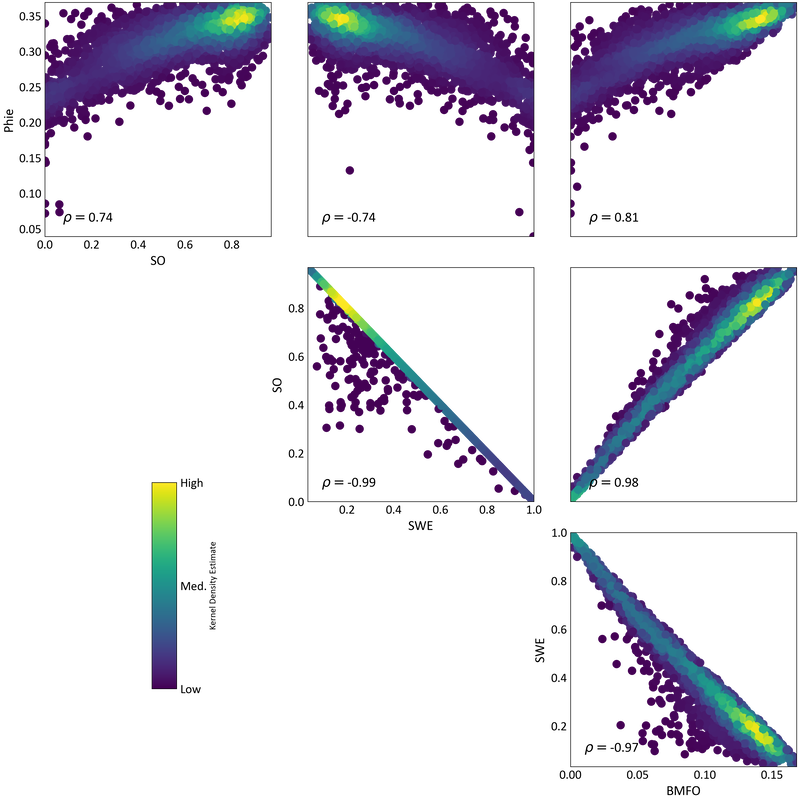
The correlation between these four variables and their bivariate relationship is depicted in figure 14. This figure reveals very important information about the data set. For instance, the very high correlation between oil saturation and bulk mass fraction of oil indicates that these two variables are essentially measuring the same phenomenon: the presence of oil. A completely inverse relationship exists between effective water saturation and the two variables, meaning that effective water saturation is measuring the lack of presence of oil. However, the relation between effective porosity and these three other variables are more complex and could be due to several different factors. Since bulk mass fraction of oil has a higher correlation with effective porosity, it is expected that Collocated Cokriging results from bulk mass fraction of oil generate better results.
Figure 14 - The bivariate relationship between the four variables. The correlation coefficient of the variables can be seen at the bottom left corner of each plot. Kernel density estimate is a measure of the density of points in the scatter plot.